
Surveying the Seas: Hydrographic, Bathymetric & Offshore Surveying with Geodetic Control
Human civilization has long been drawn to the oceans – for exploration, trade, and resources – yet mapping and understanding the seafloor and offshore environment has been a centuries-long challenge. Hydrographic surveying, bathymetric surveying, and offshore surveying are critical disciplines that allow us to measure water depths, chart coastlines, position offshore structures, and ensure safe navigation. Underpinning all of these is geodetic control and precise positioning (including offshore vessel dimension control – the calibration of survey vessels and sensors). This article provides a global historical overview of these fields, explains key methods and technologies, references international standards (IHO, ISO, FIG), and highlights real-world applications across marine industries. From the days of lead lines and sextants to today’s multibeam sonars, LiDAR, GNSS and AI-driven systems, marine surveying has evolved dramatically to meet modern needs.
Hydrographic Surveying – Charting the Waters
Hydrographic surveying is the science of measuring and describing the physical features of oceans, seas, coastal areas, lakes and rivers, mainly for the purpose of producing nautical charts for safe navigation (iho.int). It encompasses bathymetric measurements (water depths) as well as the location of hazards, coastline shape, tides and currents, and other information critical for marine use. As the basis for all maritime activities – from shipping and fisheries to coastal engineering and defense – hydrography has immense practical importance (iho.int).
Historical Overview: The history of hydrographic surveying spans centuries and is intertwined with global maritime exploration. Before modern instruments, mariners measured depth with a lead line – a rope with a lead weight – and determined positions by sextant fixes on shore landmarks (nauticalcharts.noaa.gov). This laborious method provided sparse depth points, limiting chart accuracy and leaving vast gaps between soundings (nauticalcharts.noaa.gov). By the 19th century, many seafaring nations had established dedicated hydrographic offices (e.g. the British Admiralty Hydrographic Office in 1795 and U.S. Coast Survey in 1807), but each often used its own methods and chart datums (wikipedia). Recognizing the need for international consistency, an International Maritime Conference in 1889 proposed a permanent hydrographic commission (wikipedia). In 1919, a conference of 24 nations’ hydrographers convened in London to standardize charting practices and exchange data, which led to the formation of the International Hydrographic Organization (IHO) in 1921 (wikipedia)(iho.int). Since then, the IHO (based in Monaco) has coordinated global charting efforts, set survey standards, and fostered cooperation so that all navigable waters are adequately surveyed and charted (iho.int).
Throughout the 20th century, technology drove major advances in hydrographic survey capability. By the early 1900s, wire-drag surveys were used to sweep for submerged rocks between two boats – a technique that helped detect hazards by tautening a dragged wire when it snagged an obstruction (nauticalcharts.noaa.gov). The 1930s saw the introduction of the echo sounder (fathometer), which used sound pulses to measure depth beneath a vessel (nauticalcharts.noaa.gov). For the first time, hydrographers could gather continuous depth profiles along a ship’s track, vastly speeding up surveys and improving depth accuracy (nauticalcharts.noaa.gov). However, single-beam echo sounders still only collected one line of soundings at a time, leaving unmeasured gaps between lines. The mid-20th century brought further revolution: side-scan sonar (developed in the 1950s–1960s) provided acoustic imagery of the seafloor, revealing wrecks and seafloor features much like an underwater aerial photograph, and by the 1970s multibeam echo sounder systems were introduced that could measure a swath of depths across the seafloor, achieving 100% coverage of the bottom within a survey area (nauticalcharts.noaa.gov). These multibeam systems ping out fan-shaped arrays of sound beams, allowing hydrographers to map the seafloor in full 3D relief rather than just along single lines. The evolution from lead lines to multibeam sonar and digital electronics has been dramatic – what once took months of manual soundings can now be done in days with high-resolution, georeferenced digital data.
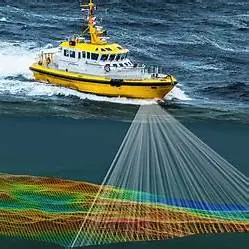
Modes of Operation, Tools & Techniques: Modern hydrographic surveying employs a suite of sophisticated tools and methodologies, often deployed from specialized survey vessels or smaller boats (and increasingly, autonomous platforms). Key techniques include:
- Single-beam and Multibeam Echo Sounders: These remain the workhorses for measuring depth. Single-beam echosounders send one sound pulse straight down; multibeam systems emit an array of downward and sideways beams, covering a wide swath of the seafloor (nauticalcharts.noaa.gov). Multibeam echo sounders require precise motion sensors and positioning – an integrated GPS/GNSS and inertial measurement unit (IMU) system corrects for the vessel’s heave, pitch, roll, and heading, ensuring the soundings can be accurately referenced in three-dimensional space (oceanexplorer). By time-stamping each echo return and knowing the speed of sound in water, the distance to the seabed is calculated for each beam. Multibeam surveys result in dense point clouds of depths, allowing the creation of detailed bathymetric maps and even photo-like 3D images of underwater features or wrecks (oceanexplorer) (Oceanexplorer). Surveyors must regularly calibrate these systems (through “patch tests” to align timing and orientation) and correct for sound speed variations in the water column (by taking frequent sound velocity profiles to account for refraction) to achieve high accuracy.
- Side-Scan Sonar: Often used in tandem with bathymetric measurements, side-scan sonar towfish or hull-mounted units emit fan-shaped pulses and record the intensity of seafloor echoes, producing an image of seafloor texture. While side-scan doesn’t give precise depths, it excels at detecting small objects (like debris, cables, or scouring) and characterizing bottom type. Side-scan data complements multibeam by ensuring no hazard or feature is missed.
- Sub-bottom Profilers: These are sonar systems (usually lower-frequency) that penetrate beneath the seabed to image sediment layers and sub-surface objects. They help identify sediment thickness, rock, or buried objects – useful for engineering and geology (e.g., pipeline route surveys or archaeology).
- Tide Gauges and Vertical Datums: Since depth soundings must be reduced to a common chart datum (usually a low-water tidal datum for navigation), hydrographic surveys involve measuring tides or water levels. Modern surveys may use real-time kinematic GNSS to derive tidal corrections or even use ellipsoid-referenced surveying (measuring depths relative to a geodetic ellipsoid and then applying a separation model to chart datum) (ihr.iho). The IHO encourages the use of vertical references like the geoid or ellipsoid to enable consistent vertical datums across regions.
- Remote Sensing and Aerial Techniques: In shallow, clear waters, LiDAR bathymetry (Airborne Laser Hydrography) is used (discussed more in the Bathymetric section). Additionally, satellite imagery and Satellite-Derived Bathymetry (SDB) techniques can estimate depths in very shallow coral reefs or coastal areas by analyzing water color. These are emerging complements for areas where traditional surveys are difficult.
- Platforms: Crewed survey ships remain vital, especially for deep ocean hydrography (with oceanographic survey vessels equipped with deep-water multibeam systems that can reach the deepest trenches). However, uncrewed platforms are increasingly used: Autonomous Underwater Vehicles (AUVs) can survey close to the seabed for high-resolution mapping (e.g., around drill sites or archeological sites), and Uncrewed Surface Vessels (USVs) can conduct hydrographic surveys without crew on board, which is useful in hazardous or remote areas. For example, autonomous survey boats have been used to map shallow estuaries and even in open ocean mapping projects, reducing risk to personnel and potentially around-the-clock operations.
- Coastal Infrastructure and Dredging: Harbor authorities rely on hydrographic surveys to plan dredging of channels and berths, monitor sedimentation, and ensure adequate depths for ever-larger vessels. Before any port construction or coastal engineering (breakwaters, bridges, tunnels), detailed hydrographic and topographic surveys guide the design.
- Marine Resource Exploration: Hydrographic surveys (often together with geophysical surveys) assist in locating suitable sites for offshore oil & gas platforms, wind farms, and seabed mining. They map seafloor conditions for jack-up rig placements or turbine foundations, and identify hazards (like pockmarks or shallow gas) that could affect operations.
- Environmental Monitoring and Marine Science: Repeated bathymetric surveys track seabed changes, such as sand movements, coastal erosion, or deposition in river deltas. Habitat mapping projects use high-resolution bathymetry and backscatter (reflectivity) to characterize benthic habitats (coral reefs, seagrass beds, fisheries grounds). Hydrographic data also feed into oceanographic models (for currents, tsunami inundation models, storm surge predictions) – a good bathymetric grid is essential for accurate modeling of how water flows. For instance, understanding why a certain coastal area floods requires a precise elevation model of the seabed and shoreline.
- Marine Boundaries and Jurisdiction: Coastal states use hydrographic and geodetic surveys to define baseline from which maritime zones (territorial sea, exclusive economic zone) are measured. Under UNCLOS, countries have mapped their continental shelf bathymetry and sediment thickness to submit claims for extended continental shelf rights – a process heavily dependent on precise surveying.
- Defense and Security: Naval forces conduct hydrographic surveys for amphibious planning, submarine navigation, mine countermeasures (searching the seabed for mines or unexploded ordnance), and to maintain tactical charts. Hydrographic intel can be mission-critical in military operations.
- Recreational and Tourism: Even recreational boating and cruise tourism benefit – for example, small craft charts, electronic depth maps for fishermen, and ensuring popular dive sites or channels are well charted for safety.