
#hydrography #survey #hydrospatial #tide #tide_guage #lat #sea #sea_level | Omar Ahmed
Technical Explanation
Certainly! Here’s a detailed explanation related to tide gauge setup in hydrography practice:
“`html
Tide Gauge Setup in Hydrography
Tide gauges are essential instruments in hydrographic surveys, used to measure changes in sea level and provide crucial data for understanding oceanographic and geodetic phenomena. Proper setup and data processing of tide gauges are critical for accurate measurements.
Instrumentation and Setup
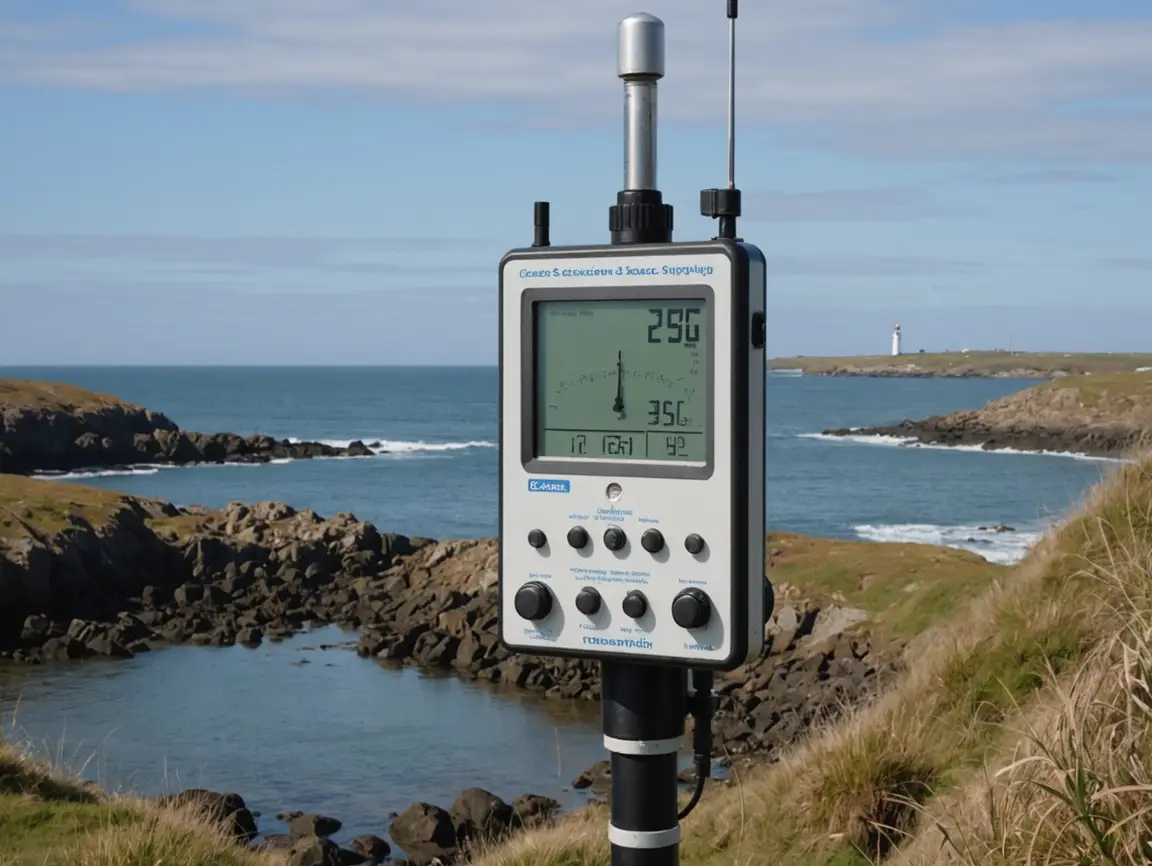
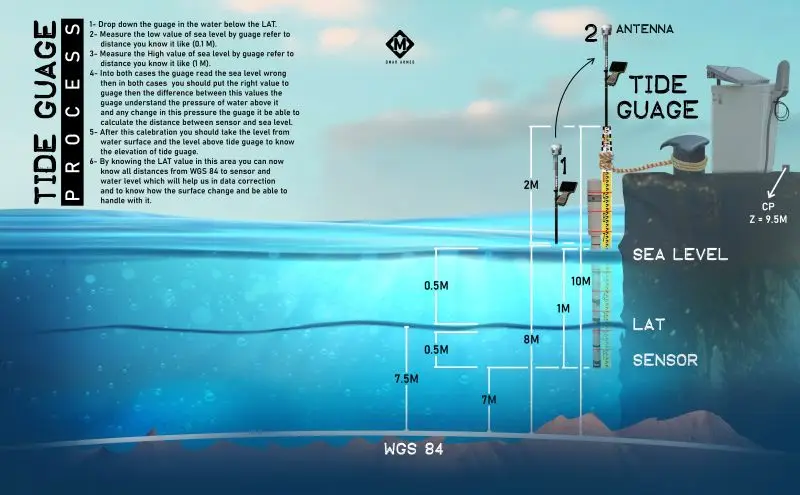
- Gauge Deployment: The tide gauge is deployed securely below the Lowest Astronomical Tide (LAT) to ensure it remains submerged under all conditions. The placement should avoid any obstructions that may affect readings.
- Sensors: Position sensors strategically to measure the water pressure and compute the corresponding sea level. Typically, pressure sensors convert the measured pressure to a sea level reading.
- Antenna Installation: Aerial antennas are used for data transmission, ensuring that the gauge communicates effectively with monitoring systems.
Calibration and Geodetic Frames
- Calibration: Calibrate the tide gauges using known water levels to ensure accuracy. This involves setting zero value references and performing regular checks.
- Geodetic Frames and Datums: Data from tide gauges align with geodetic datums such as the World Geodetic System 1984 (WGS 84). Measuring instruments often consider Mean Sea Level (MSL) or Lowest Astronomical Tide (LAT) as reference levels.
Time Synchronization
Precise time synchronization is critical for tide data accuracy. GPS-based timing ensures measurements correspond accurately to specific time frames, accounting for tidal variations.
Data Processing Workflows
- Data Collection: Continuous monitoring and data logging are essential for capturing real-time variations in sea level.
- Analysis: Post-processing involves filtering and correcting raw data to remove noise and artifacts.
- Integration: Combine tide gauge data with other hydrographic data, such as bathymetric surveys, to enhance spatial understanding.
Quality Assurance and Uncertainty
- QA/QC Processes: Implement rigorous quality assurance and control measures to maintain data integrity, including cross-verification with secondary instruments.
- Uncertainty Estimation: Quantify and minimize uncertainty by analyzing error sources and applying systematic corrections.
Real-World Applications
Tide gauges have diverse applications, from coastal management and navigation safety to climate research. Understanding and predicting tidal behaviors assist in preparing for sea level rise and extreme weather events.
The effective setup and utilization of tide gauges are cornerstones of modern hydrographic surveying, providing vital data to support a wide array of scientific and practical initiatives.
“`
This structured explanation ensures a comprehensive understanding of the technical aspects surrounding tide gauge setup in hydrography.
Details & Context